Overview
The deepdep package provides tools for exploration of package dependencies. The main deepdep() function allows to acquire deep dependencies of any package and plot them in an elegant way. It also adds some popularity measures for the packages e.g. in the form of download count through the cranlogs package. Uses the CRAN metadata database and Bioconductor metadata.
Exploration tools:
Visualisation tools:
plot_dependencies()plot_downloads()-
deepdep_shiny()runs shiny application that helps to produce a nice deepdep plot
Installation
# Install from CRAN:
install.packages("deepdep")

# Install the development version from GitHub:
devtools::install_github("DominikRafacz/deepdep")
Examples introduction to the deepdep package
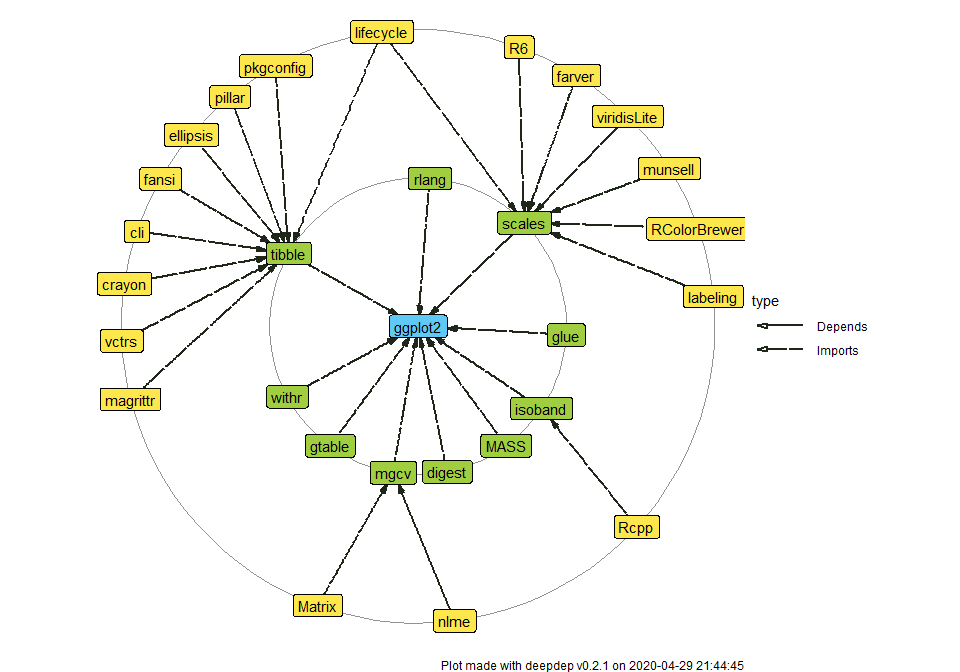
##    origin    name  version    type origin_level dest_level
## 1 ggplot2  digest     <NA> Imports            0          1
## 2 ggplot2    glue     <NA> Imports            0          1
## 3 ggplot2  gtable >= 0.1.1 Imports            0          1
## 4 ggplot2 isoband     <NA> Imports            0          1
## 5 ggplot2    MASS     <NA> Imports            0          1
## 6 ggplot2 mgcv <NA> Imports 0 1plot_dependencies(dd, "circular")
plot_dependencies("bayes4psy", show_version = TRUE,
                  dependency_type = c("Depends", "Imports", "Suggests", "LinkingTo"))

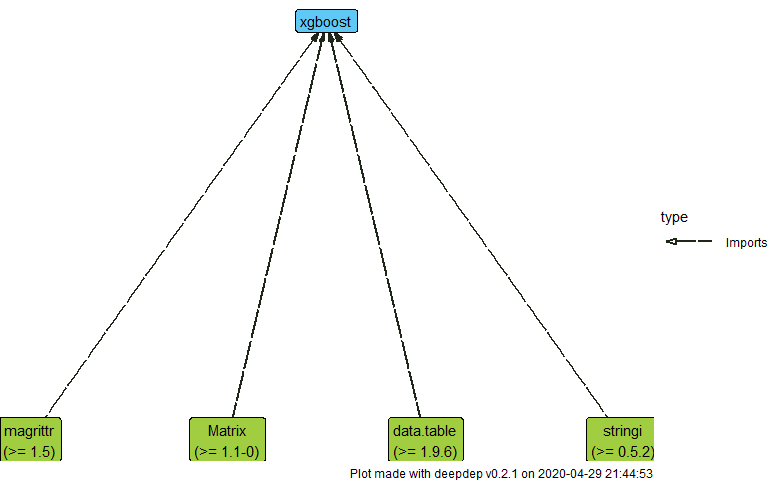
##    origin       name  version    type last_day last_week last_month last_quarter last_half grand_total origin_level dest_level
## 1 xgboost     Matrix >= 1.1-0 Imports     3044     19855      73472       255270    544340     4850922            0          1
## 2 xgboost data.table >= 1.9.6 Imports    23964    143005     511457      1584401   3169001    17607178            0          1
## 3 xgboost   magrittr   >= 1.5 Imports   196375   1338204    5097734     14864680  27025906    55832135            0          1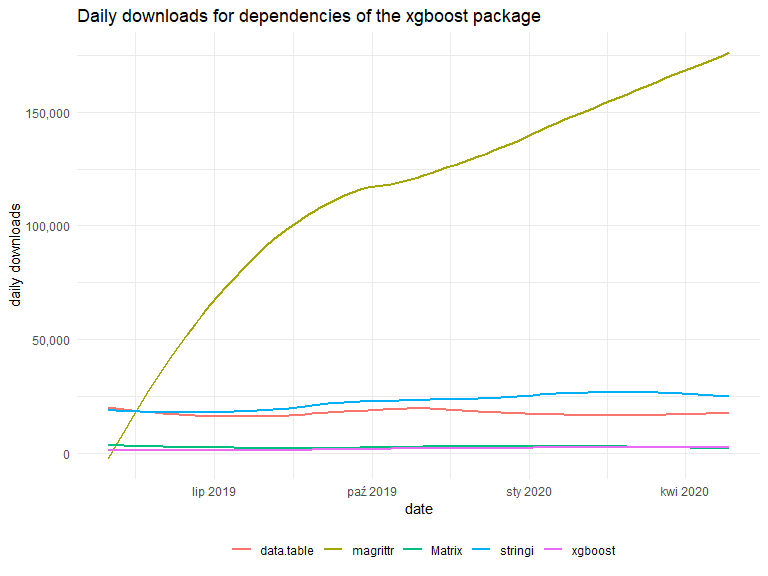
## 4 xgboost stringi >= 0.5.2 Imports 34102 200767 730874 2509641 4688808 26216128 0 1plot_downloads(dd_xgboost)
plot_dependencies(dd_xgboost, "tree", show_version = TRUE)