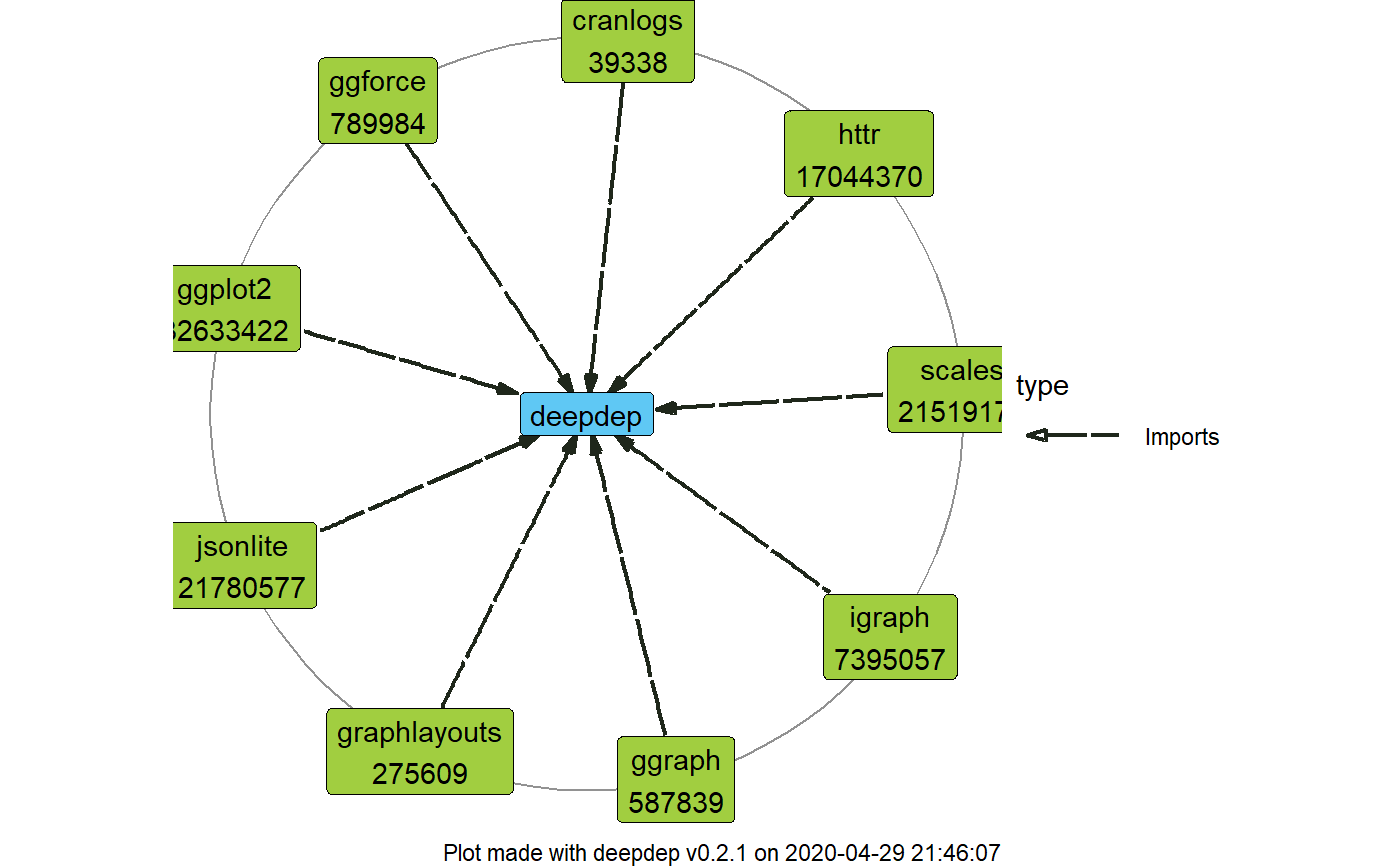
Visualize dependency data from a deepdep object using
ggplot2 and ggraph packages. Several tree-like layouts are available.
plot_dependencies(
  x,
  type = "circular",
  same_level = FALSE,
  reverse = FALSE,
  label_percentage = 1,
  show_version = FALSE,
  show_downloads = FALSE,
  ...
)

# S3 method for default
plot_dependencies(
  x,
  type = "circular",
  same_level = FALSE,
  reverse = FALSE,
  label_percentage = 1,
  show_version = FALSE,
  show_downloads = FALSE,
  ...
)

# S3 method for character
plot_dependencies(
  x,
  type = "circular",
  same_level = FALSE,
  reverse = FALSE,
  label_percentage = 1,
  show_version = FALSE,
  show_downloads = FALSE,
  ...
)

# S3 method for deepdep
plot_dependencies(
  x,
  type = "circular",
  same_level = FALSE,
  reverse = FALSE,
  label_percentage = 1,
  show_version = FALSE,
  show_downloads = FALSE,
  ...
)
Arguments
| x | A |
|---|---|
| type | A |
| same_level | A |
| reverse | A |
| label_percentage | A |
| show_version | A |
| show_downloads | A |
| ... | Other arguments passed to the |
Value
A ggplot2, gg, ggraph, deepdep_plot class object.
Examples
# \donttest{ #:# use local packages plot_dependencies("deepdep", depth = 2, local = TRUE)#:# show grand_total download count plot_dependencies("deepdep", show_downloads = TRUE)# }